Dylan Freedman
full-stack software, AI,
reporting, art, music
coding new tools for
journalists and the public
@nytimes,
prev @washpost, @documentcloud, @google
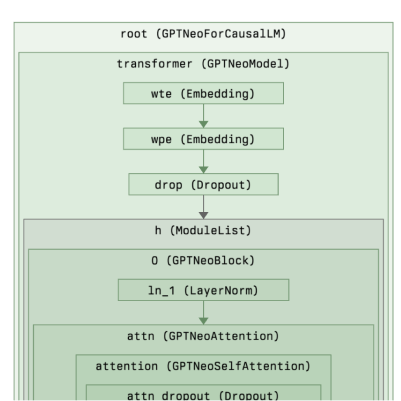
Interpogate
AI/Open Source
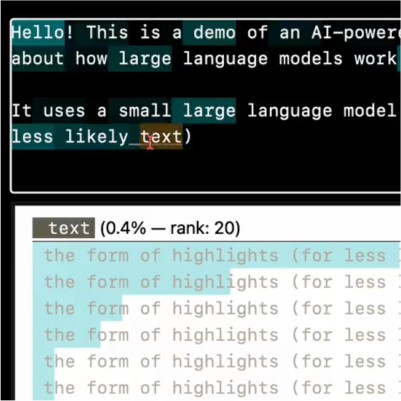
Logit
AI/Experiment
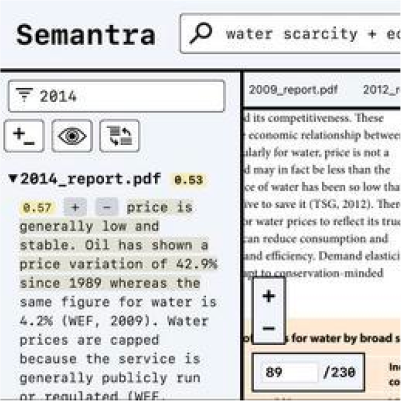
Semantra
AI/Open Source
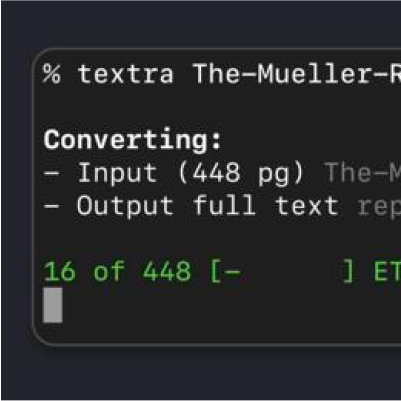
Textra
Tool/Open Source
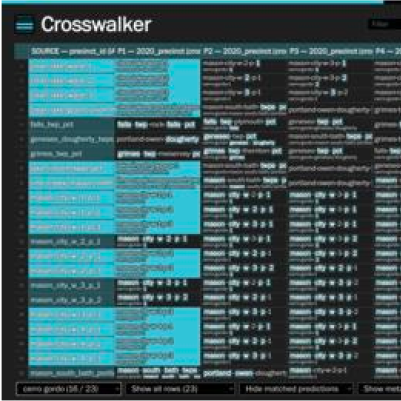
Crosswalker
Tool/Open Source
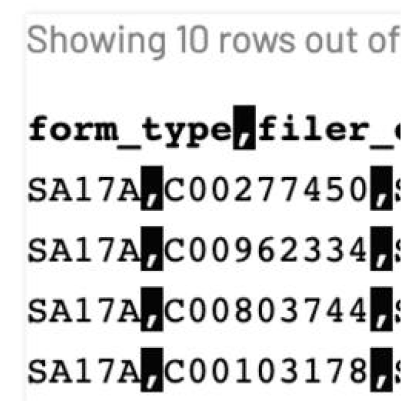
FastFEC
Tool/Open Source
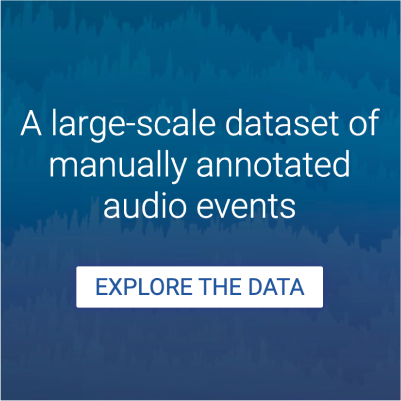
Audioset
AI/Research Dataset
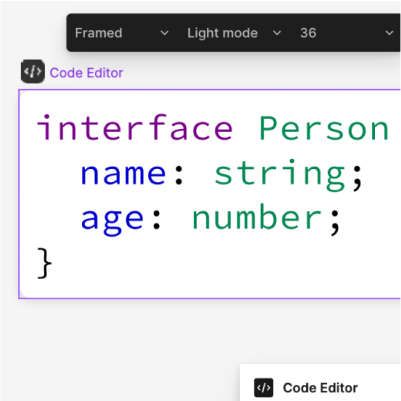
Code Editor
Figma Plugin
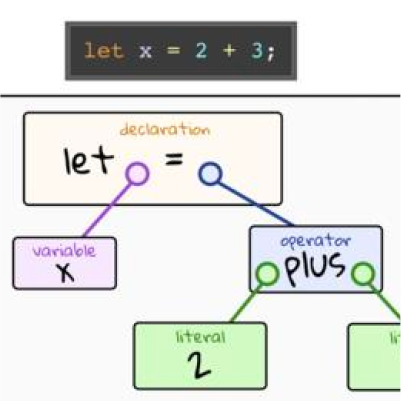
Poly
Language/Blog
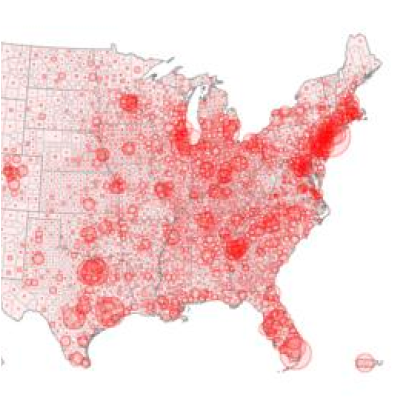
Covid19Map.us
Viz/Open Source
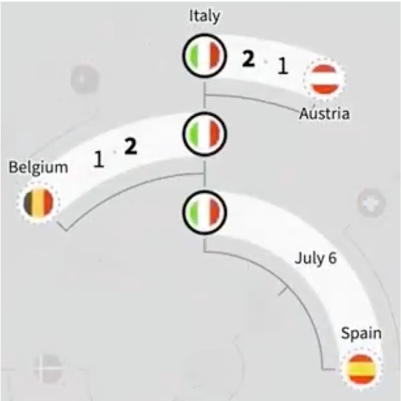
Euros
Viz/Graphics
Planet.Gallery
Art/Experiment
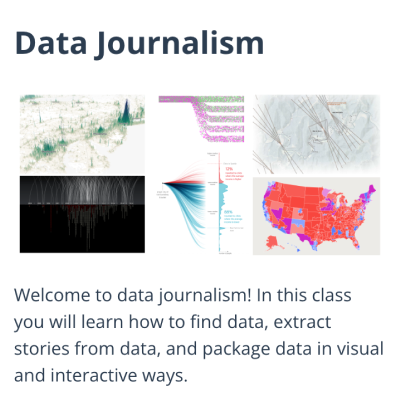
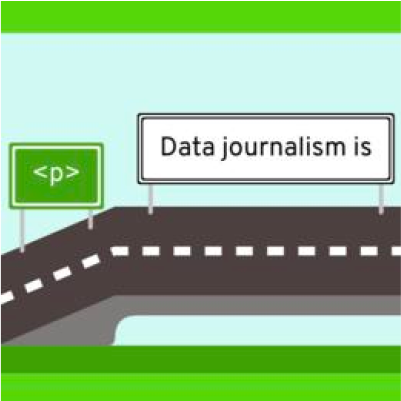
DataJourn
Course/Open Source
HTML Bridges
Teaching/Game
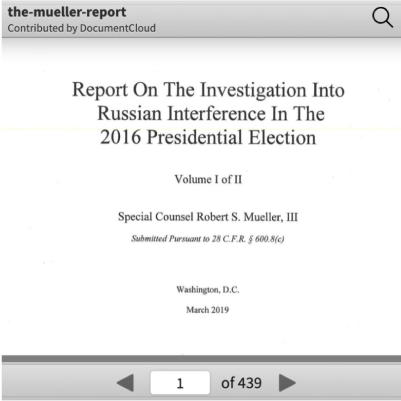
DocumentCloud
Open Source/Platform
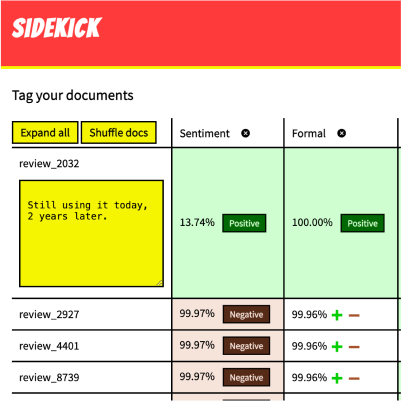
Sidekick
AI/Open Source
RipplePlastic
VR/Graphics
TapCompose
Open Source/Music
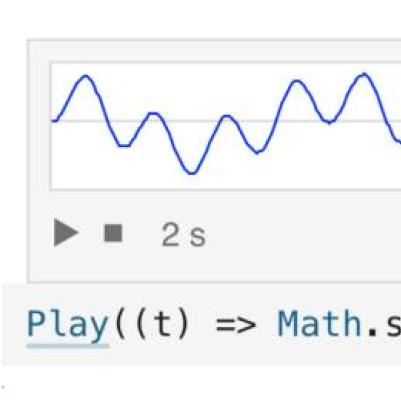
Sounds
Computational Essay
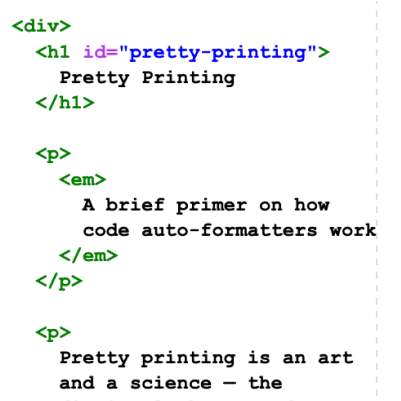
Pretty Printing
Computational Essay
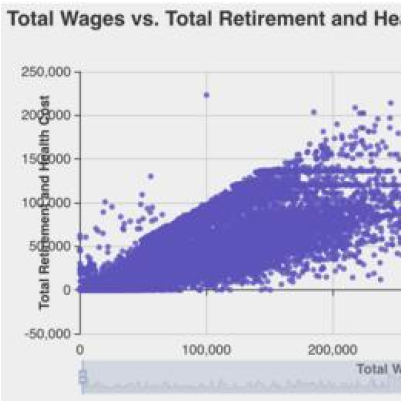
Inferactive
Open Source/Data
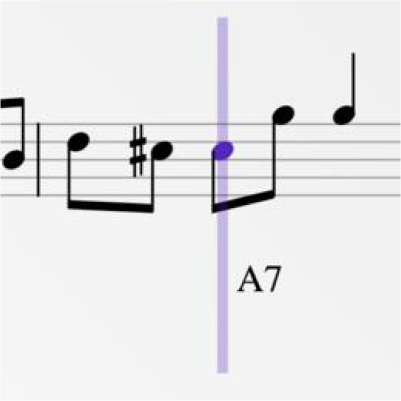
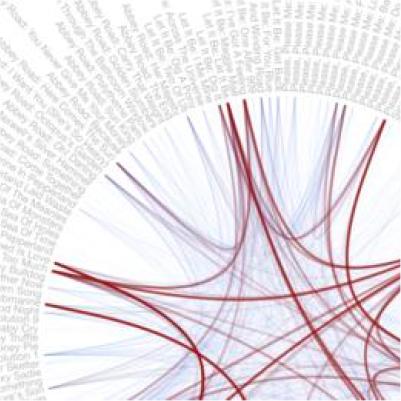
Sonority
AI/Music
FOIA Facelift
Art/Experiment
DankLearning
AI/App
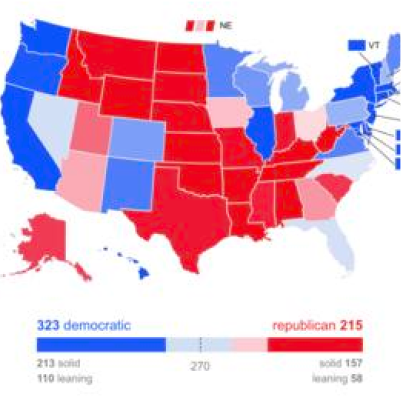
Elex Forecaster
Viz/Elections
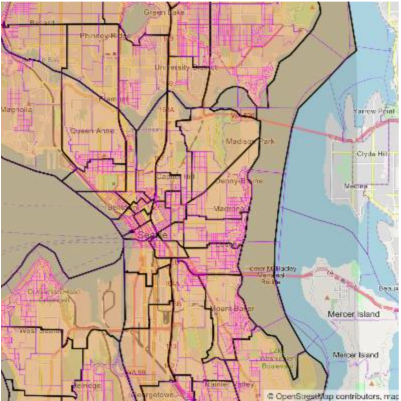
Census Shapefile
Data/Tool
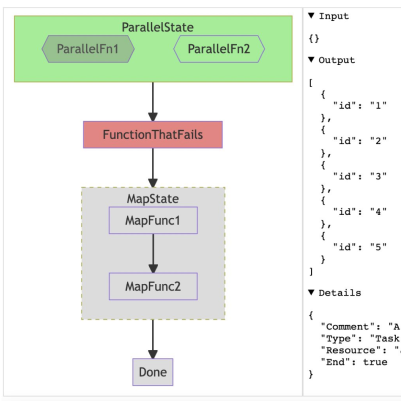
Stepfunction Viz
Open Source/Tool
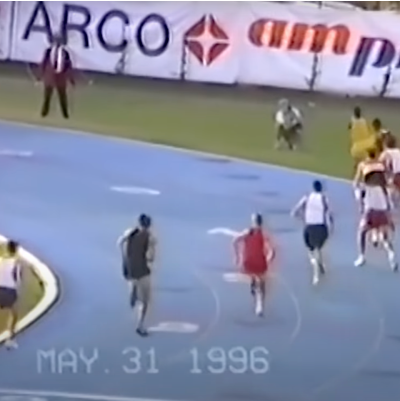
1:46.45
News/Video
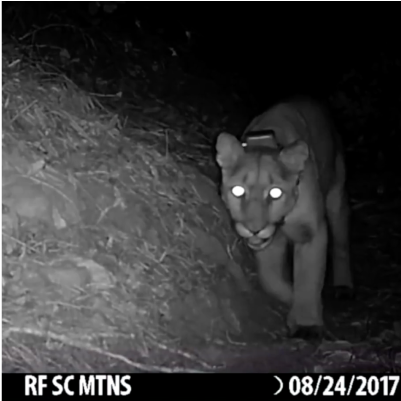
Elusive
News/Video
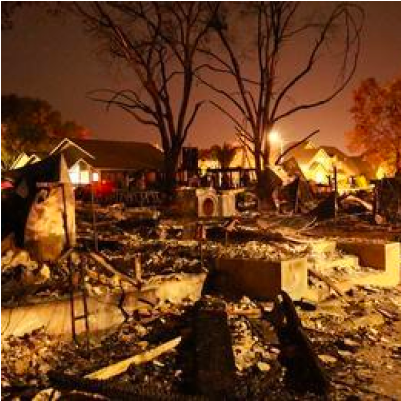
Fear Meets Fire
News/Reporting
Aero
Fitness/Game
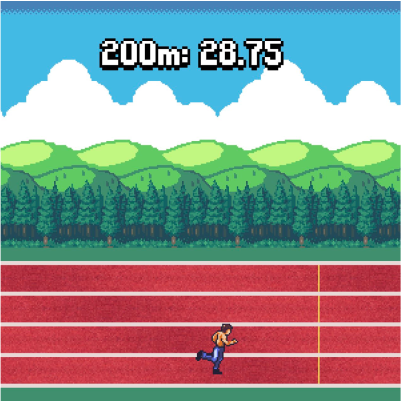
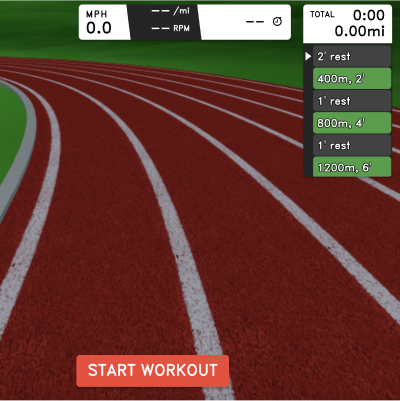
Track3D
Fitness/Game
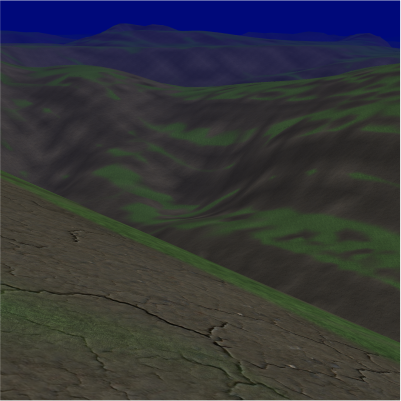
Trail Terrain
Graphics/Experiment
Infinite Terrain
Graphics/Experiment
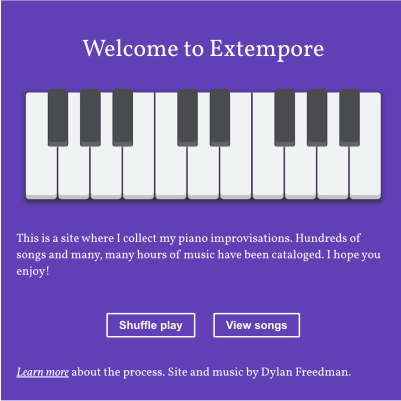
Extempore
Piano/Archive
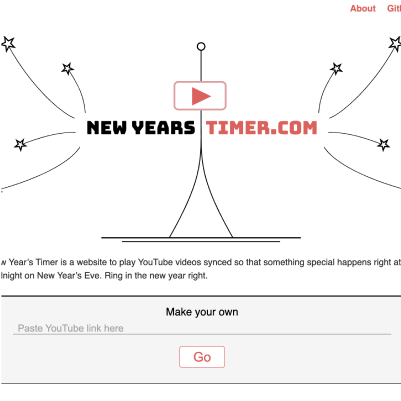
New Years Timer
Site/Fun
Distinguish
Open Source/Tool
HueNote
Music/Experiment
Keyboreal
Music/Experiment